Looking for a powerful data dashboard platform that can load your data, generate interactive visualizations, and help you make informed decisions! Our fully customizable dashboard system allows you to upload datasets, create dynamic charts, explore metrics, and build real-time reports, all in one place. Whether you’re a business team, developer, analyst, or operations manager, this dashboard provides a centralized solution for data monitoring, reporting, and visualization.
Key Features of Our Custom Dashboard
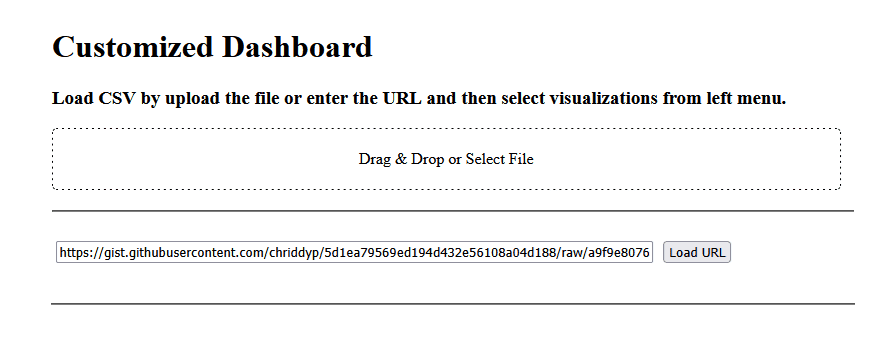
Load Data from Multi Sources
Our system supports CSV data formats from multi sources so you can build dashboards that exactly match your needs. As an example, you can upload data file from your local computer or even can use the data URL link. No matter where your data lives, the dashboard adapts, loads, and prepares it for analysis in seconds.
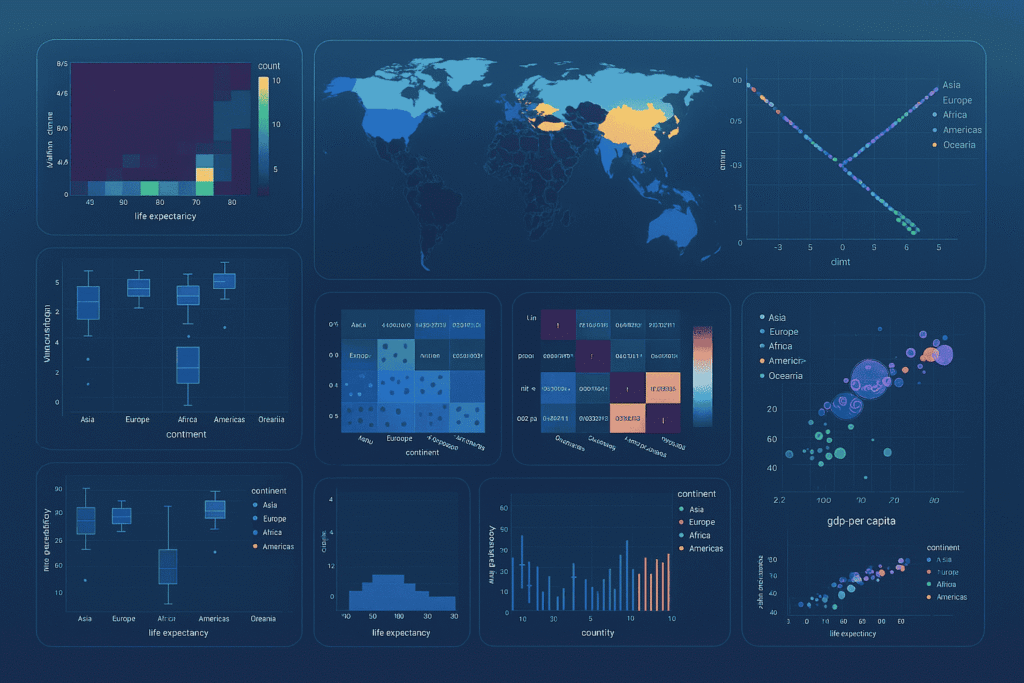
Generate Interactive Charts and Tables
Create clear, insightful visualizations with just a few clicks. Supported chart types include:
Tables including sample tables, summary and statistical tables.
Basic plots such as scatter, bar, line and grouped bar plots.
Statistical plots including histogram, box plot, violin, and correlation heatmap.
Geospatial plot.
Dimensionality reduction plots such as scatter matrix, TSNE and PCA plots.
Advanced plots including hexbin, 3D scatter plot, regression and word cloud plots.
Every visualization is highly customizable so you can tailor it to your specific needs.
Real-Time Data Monitoring & Easy Data Analysis Tools
Get up-to-date insights with:
Automatic refresh intervals that consider new data when they are added to the dataset.
Live chart updates in terms of changes.
Filtering and searching data in tables.
Which are perfect for operational monitoring, system performance, IoT data, and continuous reporting.
Try the Live Demo
Explore the Open-Source Code
Experience the dashboard directly in your browser through our fully interactive Hugging Face Spaces demo. No installation. No setup. Just open the demo and start exploring how the dashboard loads data, generates visualizations, and performs real-time analysis.
Our dashboard platform is built with transparency and community collaboration in mind. To support developers, researchers, and organizations who want to extend or integrate the system, we provide full access to the source code on GitHub.